Z scores distort the distribution
Z-scores are a common normalization method applied to data that is normally distributed.
Math
{python}normalized_data = (data - mean) / std
mean and std are robust against moderate outliers.
Implementation
def z_score_normalize(data: np.ndarray):
    mean = data.mean()
    std = data.std()

    normalized_data = (data - mean) / std

    return normalized_data
in practice, people use the
{python}StandardScalerfrom scikit-learn to normalize their features. Under the hood this calculates a z-score.from sklearn.preprocessing import StandardScaler
scaler = StandardScaler()
X_train_scaled = scaler.fit_transform(X_train)
# To avoid bleeding from test set: Use scaler's μ and σ from training
X_non_train_scaled = scaler.transform(X_non_train)
Example
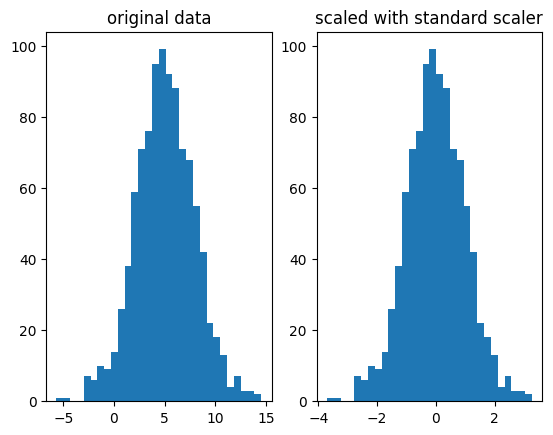
Same distribution and shape, but centered around 0 and with a std deviation of 1.
When not to use
- The distribution is not Gaussian
- There are strong outliers present. (deal with them and then apply it).
An alternative, that can deal better outliers and non gaussian data: robust scaler, normalization