Refer to Model classification metrics to understand when to use it and how to interpret it.
from sklearn.metrics import roc_auc_score, roc_curve
# generate a no skill prediction (majority class), optimal outcome = true
# choose 0 or 1 depending on which one is the majority class.
ns_probs = [0 for _ in range(len(y_pred))]
# this example model is a linear regression model.
predictions = example_model.predict_proba(X_test)
# keep only for the positive outcome
predictions = predictions[:, 1]
# calculate scores
ns_auc = roc_auc_score(y_test, ns_probs)
lr_auc = roc_auc_score(y_test, predictions)
# summarize scores
print('No Skill: ROC AUC=%.3f' % (ns_auc))
print('Logistic: ROC AUC=%.3f' % (lr_auc))
# calculate roc curves
ns_fpr, ns_tpr, _ = roc_curve(y_test, ns_probs)
lr_fpr, lr_tpr, _ = roc_curve(y_test, predictions)
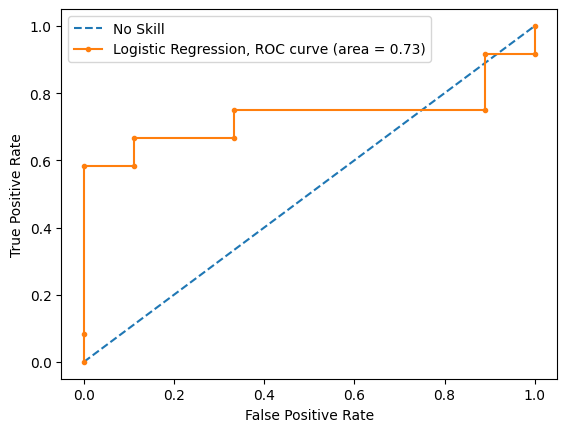
# plot the roc curve for the model
plt.plot(ns_fpr, ns_tpr, linestyle='--', label='No Skill')
plt.plot(lr_fpr, lr_tpr, marker='.', label='Logistic Regression, ROC curve (area = %0.2f)' % lr_auc)
# axis labels
plt.xlabel('False Positive Rate')
plt.ylabel('True Positive Rate')
# show the legend
plt.legend()
# show the plot
plt.show()