Interesting Library Overview
Pillow:
seems to be the default approach to image handling in python.
Basic image display
from PIL import Image
from IPython.display import display


img = Image.open("cat.jpg")
display(img)
Convert the image to a grayscale:
gray_img = img.convert("L")
Convert a grayscale image back to RGB
It will still be gray, but we can make so that it has 3 channels
{python}
Do some edge detection
edges = gray_img.filter(ImageFiler.FIND_EDGES)
Convert the image to an array.
data = np.asarray(img)
# height: shape[0], width: shape[1], colour channels: shape[2]
print(data.shape) # (1300, 929, 3)
Convert an array into an image
img = Image.fromarray(data) # you might still have to convert the array via .astype(np.uint8), depending how you created the array.
Pillow does not support float value array images (RGB values going from 0 to 1). You can fix this like this:
img = Image.fromarray((x * 255).astype(np.uint8)) # note that the type conversion truncates the values after the decimal point, which is why the conversion needs to be done after multiplying by 255.
Add gaussian noise
# original image as a float numpy array with values between 0 and 1
def add_gaussian_noise(Original_Image):
    mean = 0
	# meant for float values in
    sigma = random.uniform(0.01, 0.02)

    gaussian = np.random.normal(mean, sigma, (Original_Image.shape[0],Original_Image.shape[1], Original_Image.shape[2]))
    noisy_image = Original_Image + gaussian
    return noisy_image
cv2: For more advanced image processing
This Library prefers a more array approached format. It has a huge amount of functions that help modify images.
The source images need to be read with cv2.
Invert an image:
{python}inverted_img = cv2.bitwise_not(img)
The image needs to be an array for cv2 to be able to process it. See below how to do it if you only have a filepath.
import cv2
from PIL import Image
import numpy as np

filepath = "cat.jpg"
img_arr = np.asarray(Image.open(filepath))

inverted_img = cv2.bitwise_not(img)
binarise an image:
There are many different approaches, with more complex automated ways of handling thresholds. However in my experience those do not work well, it is better to use a dead simple manual threshold approach, that we can perfectly adapt to our use-case.
{python} _, binary_image = cv2.threshold(img, threshold_value, 255, cv2.THRESH_BINARY)
documentation:
cv2.THRESH_OTSU), this value is automatically determined and returned as a first param. Otherwise it simply returns the set threshold_value.threshold(src, thresh, maxval, type[, dst]) -> retval, dst
# thresh: any value above thresh will be put to maxval. in our case 255 or white.
# The type determines how the thresholding will be applied. In our case: cv2.THRESH_BINARY, if the pixel value is greater than thresh it is set to maxval, otherwise it is set to 0.
remove noise from an Image
For a gray-scale Image
{python} denoised_img = cv2.fastNlMeansDenoising(src, dst=None, h=3, templateWindowSize=7, searchWindowSize=21)
src: the input image. It should be a single-channel (gray-scale) image.
dst: set to None to immediately return by the function
h: controls the strength of the denoising
templateWindowSize: It controls the window size
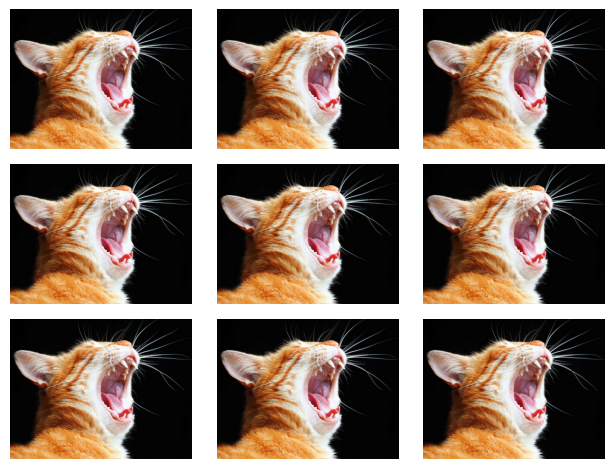
Create an image grid
Grid layout
Example with fig.add_subplot
def create_image_grid(images, show_axis=True):
    amt_images = len(images)
    if amt_images > 9:
        raise ValueError("Can only visualize up to 9 images at once.")

    # we want a max of 3 columns.
    # it is important that both of these variables are integers!
    amt_cols = min(3, amt_images)
    amt_rows = int(np.ceil(amt_images / amt_cols))

    fig = plt.figure()

    for i, image in enumerate(images):
        # Iterating over the grid returns the Axes.
        ax = fig.add_subplot(amt_rows, amt_cols, i + 1)
        ax.imshow(image)

        if not show_axis:
            ax.axis('off')

    # adjust spacing between subplots.
    plt.tight_layout()

    plt.show()
example with plt.subplots:
def create_image_grid(images, global_title=None):
    if amt_images > 9:
        raise ValueError("Can only visualize up to 9 images at once.")

    amt_images = len(images)

    amt_cols = min(3, amt_images)
    amt_rows = int(np.ceil(amt_images / amt_cols))

    fig, axs = plt.subplots(amt_rows, amt_cols)

    if global_title:
        fig.suptitle(global_title)

    for i, img in enumerate(images):
        row, col = divmod(i, amt_cols)
        axs[row][col].imshow(img)

    # Globally turn off all axes
    for ax in axs.flat:
        ax.axis("off")

    plt.show()