Theory about this was taught in the Responsible AI course.
This is the hard part
Visualise the model
print(model)
Will print the model structure. Good to visualise the layers.
Inspect the model parameters
= ... to be returned by model.named_parameters()
for name, param in model.named_parameters():
    if param.requires_grad:
        print(name, ": ", param.data)
Log inspections
Model classification metrics are much more significant than training and testing losses.
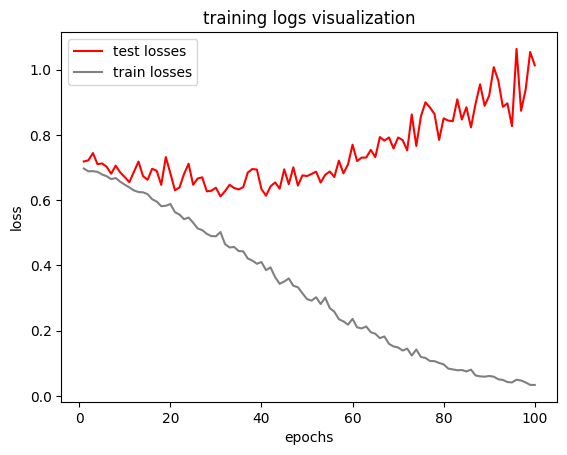
def visualize_training_logs(test_losses, training_losses):
    epochs = np.arange(1, len(test_losses) + 1)
    plt.plot(epochs, test_losses, label="test losses", color="r")
    plt.plot(epochs, training_losses, label="train losses", color="gray")

    plt.xlabel("epochs")
    plt.ylabel("loss")
    plt.title("training logs visualization")
    plt.legend()

    plt.show()
we can see strong overfitting in the graph below. However the model seems to learn something at the beginning.